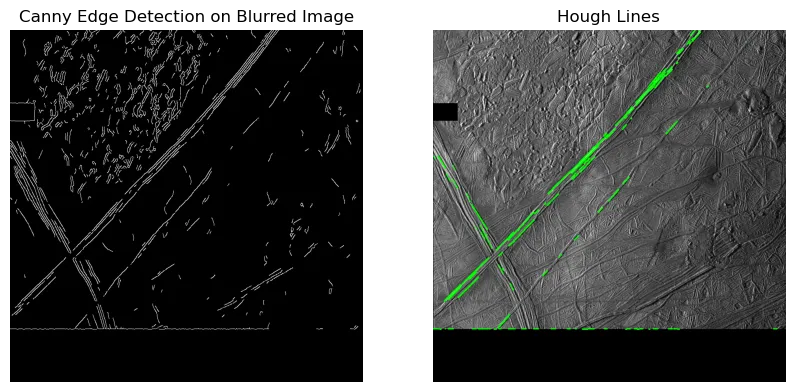
In my last progress report, I had gone over a few types of image processing techniques I intend on using for this project.
One of the main ones which I will be relying on is the Hough Transform.
For each point on an image, it ‘scans’ lines at every angle. It accumulates & counts the number of bright pixels (commonly, a Hough Transform is applied on a thresholded image). Then, it votes on the most likely lines, by selecting those with the highest amount of accumulated pixels. There’s many articles & guides on how it’s done, but for ease I’m using the opencv Hough transform and probabilistic Hough transform.
Below is an example of where I was at last time:

My current main objective is to optimize the parameters of the canny edge detector, and for the hough lines.
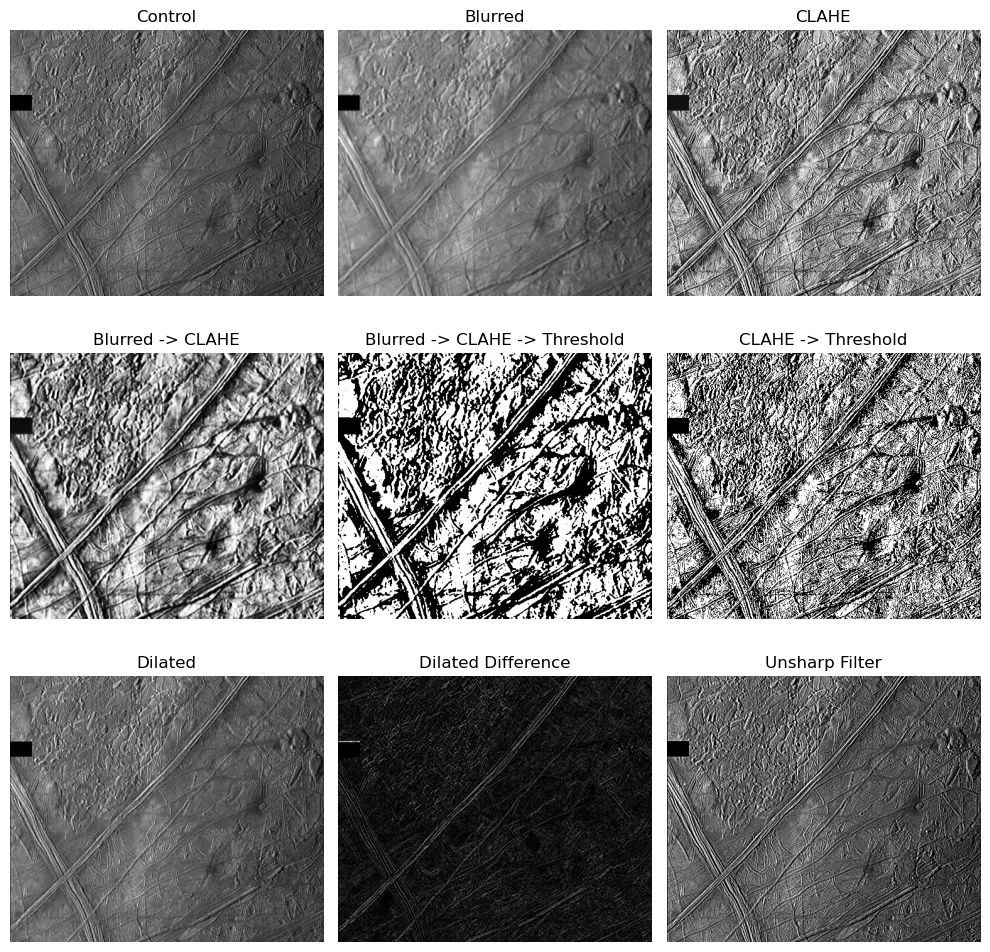
First, I’m going to test out many of the filters mentioned last time - I’d like to see which ones get rid of the noisy areas (chaos region, top right) the best.
Here’s my results:
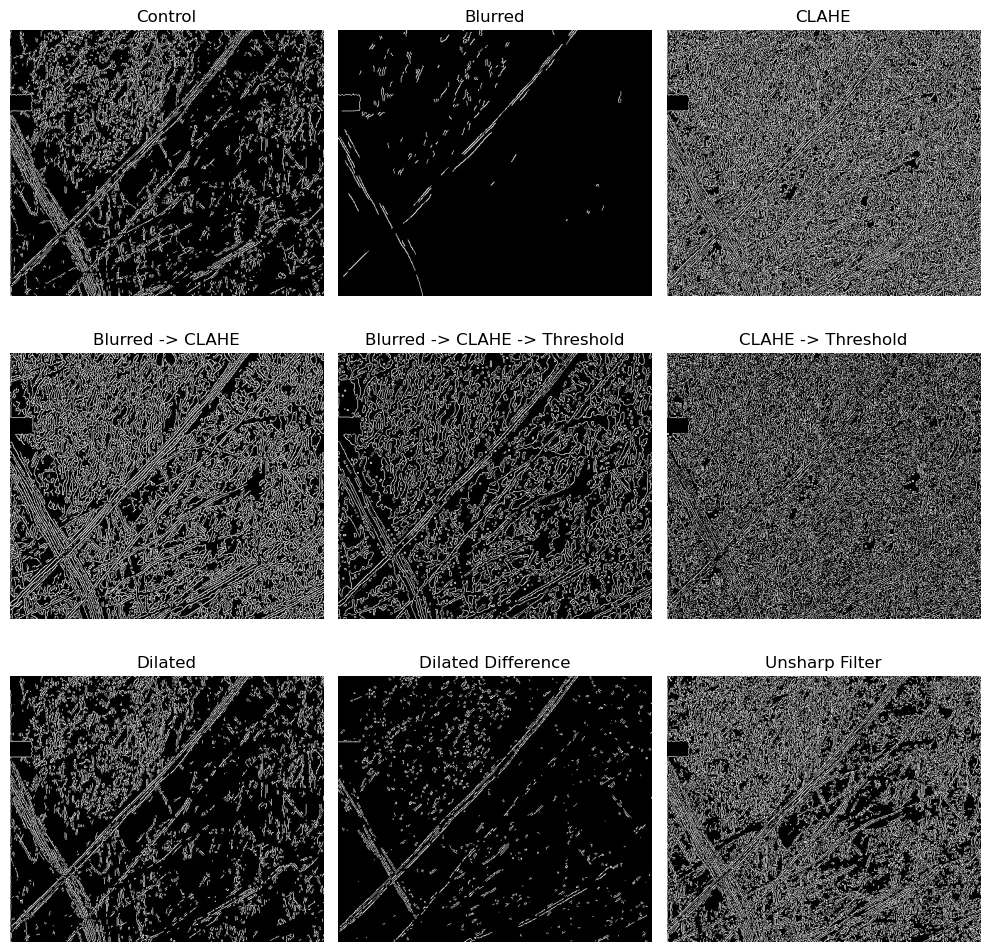
 Of course, one problem here is that I shouldn’t use the same canny parameters for all of these images! Here’s what I get for using the same canny parameters on each image:
 And, here’s what I get for implementing this method, which uses the median pixel value as basis for the canny parameters. This works in a similar way as otsu’s method, a way for finding a threshold value which well-balances the resulting image.
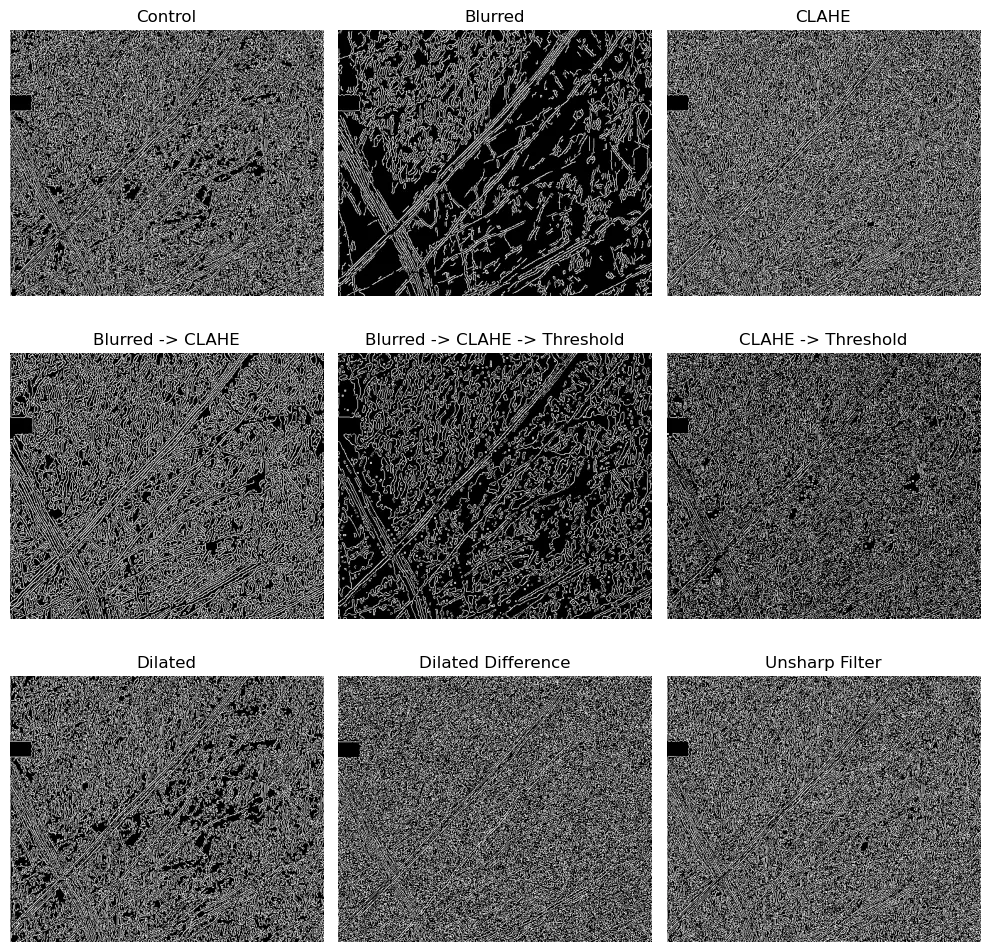 And… That’s significantly worse. It all but removed the large crevasses down the middle, and enhanced the detail of the noisy chaos terrain.
[!attention] I think this method of finding parameters for canny edge detection didn’t work partially because it limits the values between 0 & 255, which are the minimum and maximum values in a greyscale image. However, these ‘thresholds’ from the canny parameters have a larger range, since they operate on the magnitude of two perpendicular gradients. See this post for more information.
I decided to stack a few images with varying canny thresholds, to get a more visual feel of how they modify the result. Here they are:
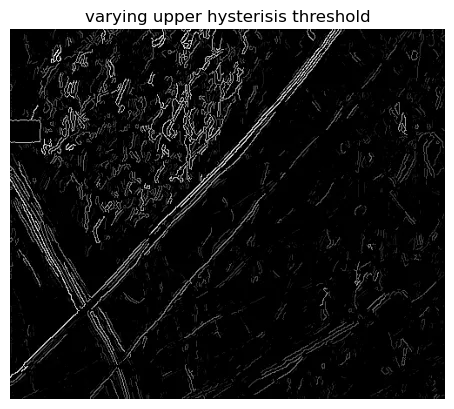
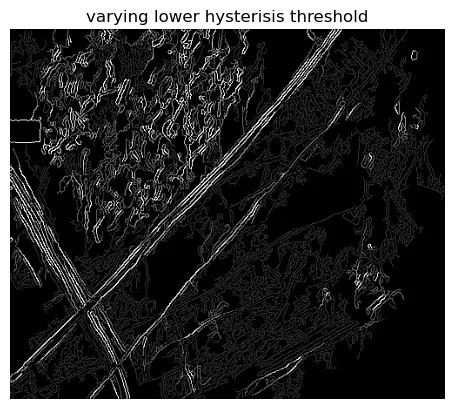 They seem the same, but there’s actually a lot of very useful information in these plots. First of all, see those dark grey squiggles in the bottom right of image 1? It seems like a smaller min threshold value will result in smaller features being combined into larger lines, creating those ‘scribbles’. In image 2, which started with a relatively high min threshold, only the edges that continue in the same direction for a while make it through the filter.
Additionally, it definitely seems like increasing the maximum filter removes smaller and smaller features, with only the very long lines in the center and the longer parts of the chaos region remain.
I wish there was a way to further limit the amount of ‘curvature’ in these lines. Opencv has some features for contours, making polygons, rectangles, etc. Additionally, it could prove useful to modify the ‘L2 gradient’ step of canny edge detection, in order to make it even more selective.
That said, I’m going to move on from canny edge detection now, and would like to focus on the next step of this project - image pyramids!
In the first part of this project, I worked with many types of filters. These filters most often use “kernels”, which define the area around any individual pixel which the filter acts on. A wider kernel (e.g. 5x5) has a larger effect than a smaller one. I won’t go further into depth about these, as the math is surprisingly intuitive. One important thing is that a 3x3 kernel will have a much larger effect on a smaller image than a large one.
Since I’ll be working with images of varying sizes, I often end up downscaling them. Of course this removes data! What’s the solution? Well, If I wanted to work with 200x200 images, for example, I would just split each image into 200x200 chunks, then operate my filters and processing on each of those individually! If there’s overlap, I can combine the results later.
Additionally, I can use scaled-down versions of the original image and the individual chunks of the image - using a scaled-down original image should also isolate larger features and remove smaller noise values!
Of course, this technique has been well described, and is also used in LineaMapper, a past project which inspired this one! I think it’s especially useful for Europa (and planetary science in general) because of how many fractal features there are. As in, features which appear in similar ways in varying magnitudes of scales.
Since there hasn’t been an image in a while, here’s a bonus image - a wide-angle image of Europa, split into chunks and with a Canny filter applied. (from this notebook)
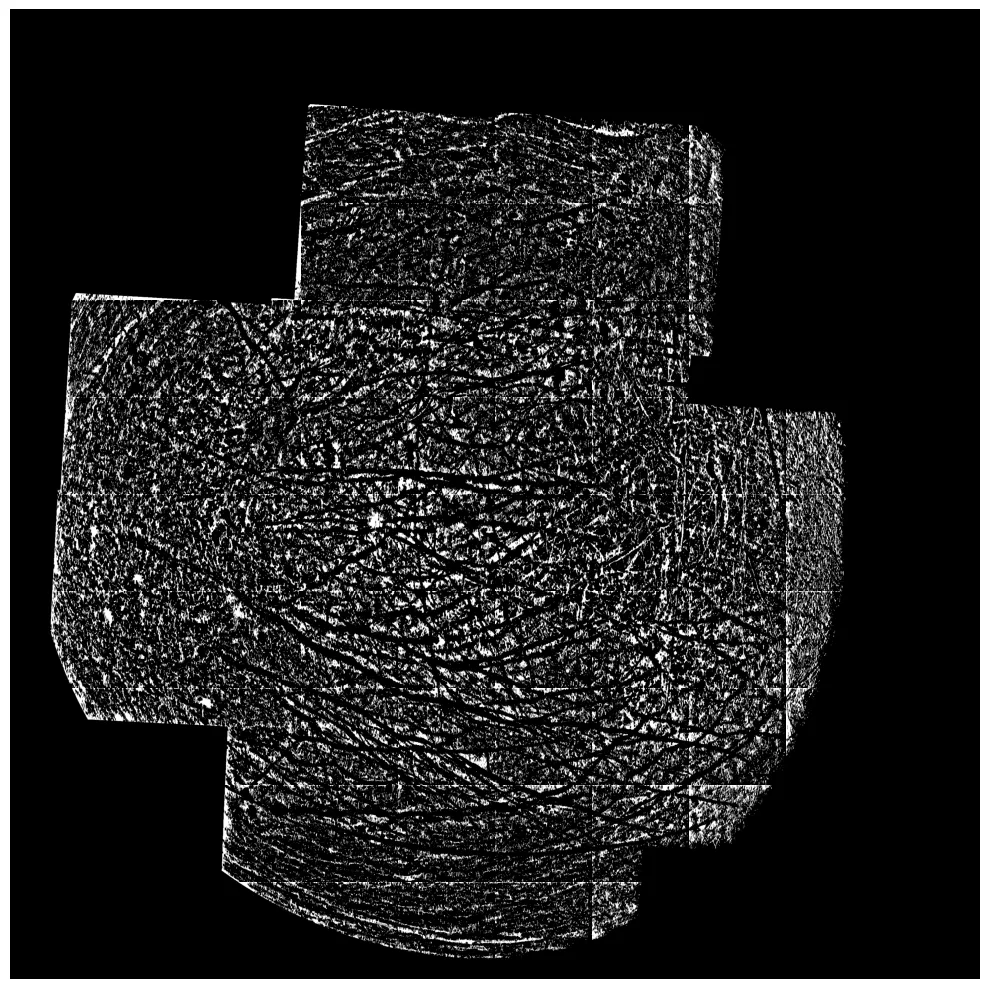
Here’s an example of splitting the original image into smaller-resolution grids:
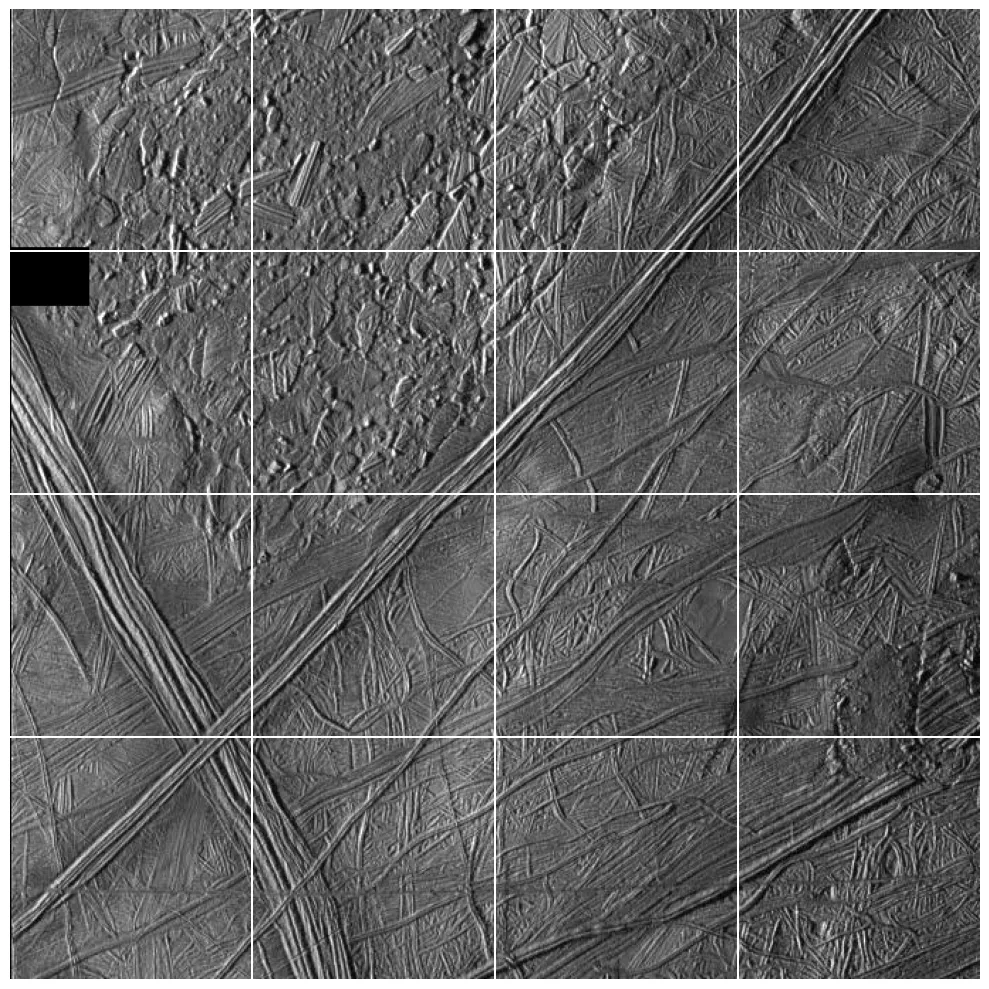
And, here’s a downscaled version of that original image using cv.pyrDown:
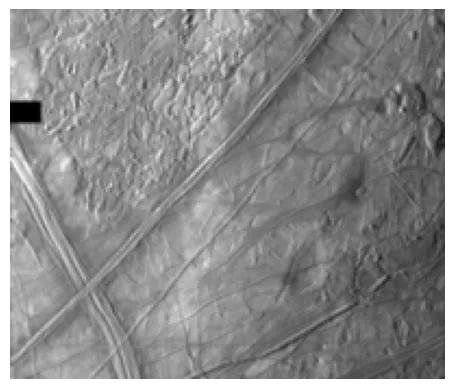 (With the same resolution as each individual tile from above).
And, just for fun, with the canny filter:
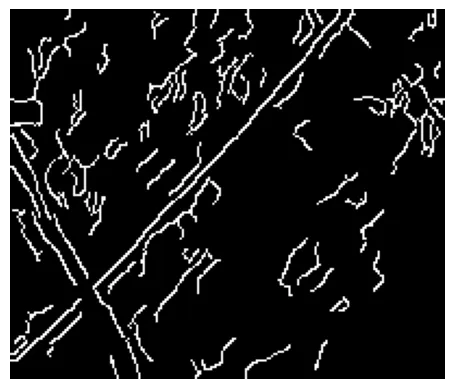 This result is MUCH better than I expected. This is the first time where the large line through the middle is part of the same ‘edge’, instead of many different ‘edges’!
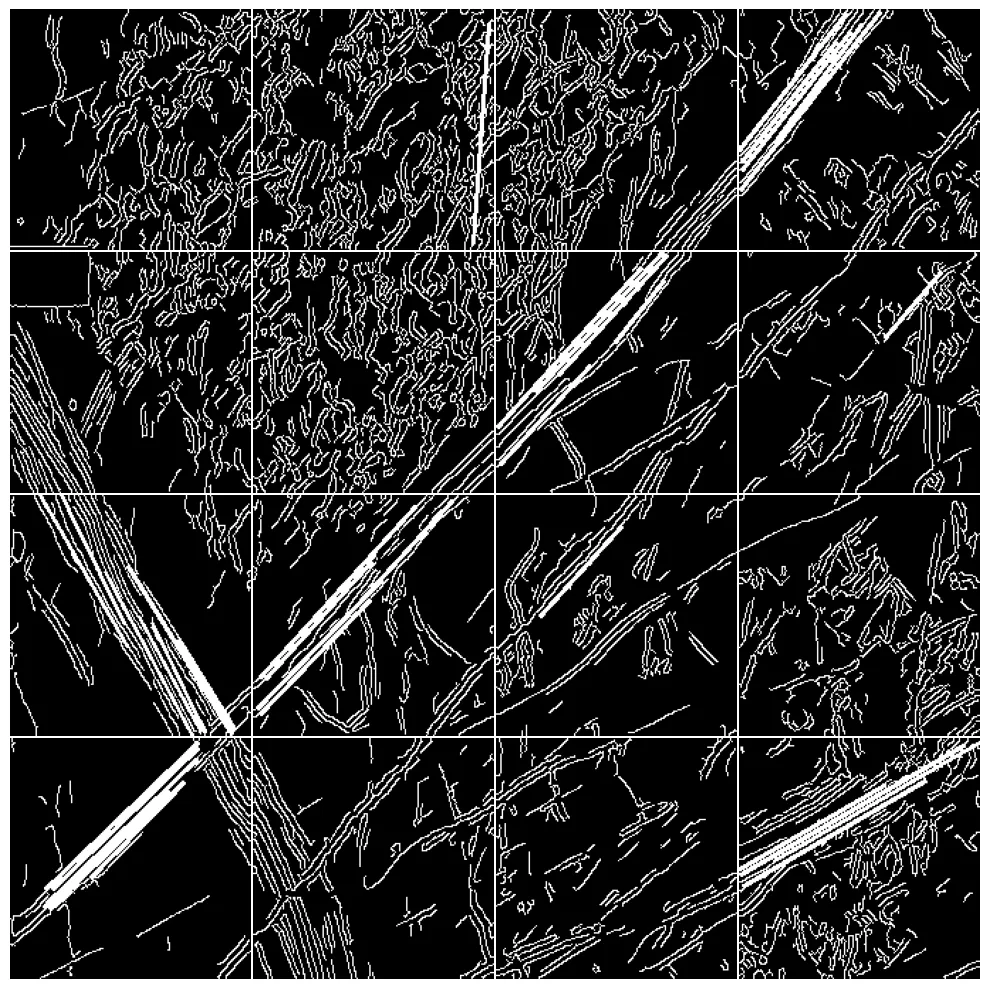 This is the same tiled image as above, with the canny filter & hough transforms applied. As expected, the result is basically the same as before.
Additional downsides are that it’s difficult to detect constituent lines… Take a look at the grid tile in the first row, third column. Since the large line goes through the corner, it remains undetected. Of course, large features like these would be better detected in a downscaled version of the full image, as above.
This technique should be better once I begin tuning the parameters of the canny & hough filters, which brings me to the end of this post.
Something that will prove useful for this project is a way to ‘grade’ or ‘score’ results. For example, I’d like to be able to very easily see how well the predicted lines line up with the actual features on the image.
Another thing that could be useful is predicting the locations of chaos terrain and removing them from these images, as they provide no useful features for this model (unless…). This seems like a completely different project though, so I’ll see if I have time to tackle it.
Again, all the code I made & used for this is in this repository
The first part is from Rowan-Nag/Europa-Cycloided/europa-filters-further.ipynb.
The second part is from Rowan-Nag/Europa-Cycloided/europa-houghlines-filtering.ipynb.
There’s lots of experiments which I did not include here, so check them out!